Sunday, March 18, 2012

Installing sailfish-CFD under PythonXY

image

Discussion

Sailfish CFD is an interesting python program. It uses OpenCL to solve fluid flow problems using the Lattice-Boltzmann method. Sailfish uses PyOpenCL or PyCuda to manage the simulations and pygame as one of its visualization packages. The following steps can be used to add Sailfish CFD to PythonXY and execute the examples using OpenCL.

Installation Steps:

  1. Install the OpenCL driver for the computer from the CPU/GPU vendor. NVIDIA drivers can be found here. Intel Drivers can be found here.
  2. Download the source using Git following the links here. If you do not use Git or don’t want to add it to your machine, a portable version is available here.
  3. Since the developers do not offer packages (yet?), use git to clone their repository. I clone to a temp directory, then work from there.
    • git clone git://gitorious.org/sailfish/sailfish.git c:\temp\sailfish
    • The repository can be viewed through a GUI using the gitk command.
  4. I like to keep the python pieces together, so I copy the contents of the sailfish directory from my temp location to the a sailfish directory created under c:\Python27.
  5. There appears to be an issue with the location of the Mako files. So following the recommendation on the Sailfish google group in this exchange, copy all of the template files from “C:\Python27\sailfish\sailfish\templates” to “C:\Python27\sailfish\sailfish”.
  6. Create a file named “sailfish.pth” at “C:\Python27\Lib\site-packages”. Edit the file and add a single line with “C:\Python27\sailfish\”. This tells python to look in that directory for the sailfish modules.
  7. Test the installation by opening Python and typing “import sailfish” at the prompt. If it imports without errors, your installation is probably good.
  8. Since PythonXY works with PyOpenCL out of the box and Sailfish works with OpenCL, the examples can now be run by using the “—backend=opencl” option. Open up “C:\Python27\sailfish\examples\lbm_cylinder.py” and try to run using the opencl option.
  9. If your system does not have a GPU, you might encounter an error like “pyopencl.LogicError: Context failed: invalid value”. This is because Sailfish is configured to only use GPUs. I was able to get my installation to work on a system without a GPU, but with Intel OpenCL installed. This was done by modifying “C:\Python27\sailfish\sailfish\backend_opencl.py”  modifying line 31 from “devices = platform.get_devices(device_type=cl.device_type.GPU)” to “devices = platform.get_devices()”.
The image at the top of the posting was generated from “C:\Python27\sailfish\examples\lbm_cylinder.py”.

References:


Test Environment:

  • Win 7 Professional
  • PythonXY 2.7.2.1
  • Sailfish git commit with SHA 1 of 29d7c934be8c02cf714ce2307796a4550428b512 from 2011-11-06 at 14:35:56
  • Intel OpenCL
  • i7 CPU, no GPU
This work is licensed under a Creative Commons Attribution By license.

Saturday, March 17, 2012

Yet Another Countdown Timer Application built using .HTA (Windows HTml Applications)

image

Discussion:

The time until something is due is always important. There are a lot of countdown timers which are available. There are a lot of interesting ways to implement a countdown timer. In restricted IT environments, where installing applications is frowned upon, one approach to creating a lightweight application is using HTML Applications (HTA).  The following example shows how to use an HTA to build a standalone countdown timer which is displayed as a window.

Several techniques are used to make this countdown timer work. First, the name of the file is parsed to determine the target date and time. This way, the remaining time can be set by renaming the file. Next, javascript is used to rewrite a portion of the document by assigning a value to the ‘innerHTML’  of  div element. Then, the countdown function is called once when the body of the document is loaded. However, once the function is called, the last thing it does is reschedule itself to run again in 1 second. Finally, this file, which looks like an HTML file is saved as with the extension HTA.

Code Example:

<html>
<head>
	<TITLE>Countdown Timer</TITLE>
	<HTA:APPLICATION 
		ID="oMyApp" 
		APPLICATIONNAME="CountDownTimer" 
		BORDER="yes"
		CAPTION="yes"
		SHOWINTASKBAR="yes"
		SINGLEINSTANCE="yes"
		SYSMENU="yes"
		WINDOWSTATE="normal"
		MAXIMIZEBUTTON="no">
    <script>
		// set the window size and place it on the screen in the upper right hand corner
		var windowWidth = 600
		var windowHeight = 150
		window.resizeTo(600,150);  // Can only be done in HTA
		//half the screen height minus half the new window height (plus title and status bars).
		iMyHeight = (window.screen.height/4) - (windowHeight/2 + 50)/2;
        window.moveTo(window.screen.width-windowWidth-5,5);
    </script>
	<style type="text/css">
		body {
			background-color: green;
			color: black; 
			text-align: center; 
			font-family: arial; 
			font-weight: bold; 
			font-size: 20px;
			font-variant: small-caps;
			border: medium double rgb(0,255,15);
			width:100%;
			overflow: hidden;
			filter:progid:DXImageTransform.Microsoft.Gradient(endColorstr='#00C000',
						startColorstr='#00FFFF', gradientType='0'); 			
			}
	</style>
</head>
<body>
	<!-- Define a division for displaying the countdown message -->
	<div id="countdown" ></div>
	<!-- Define the actions to take when the body loads -->
	<script>
	// parse the filename to get the target date and time
	var filename = String(window.location)              // get filename
	var iSubStrEnd = filename.lastIndexOf('.')       // get point in string where the date data may end
	var iSubStrStart = filename.lastIndexOf('.',iSubStrEnd-1) // get point in string where the date data may start
	if ((iSubStrEnd>0)&&(iSubStrStart>0)&&(iSubStrStart<iSubStrEnd)) {
		// get the date string from the file name
		endDateTime = filename.slice(iSubStrStart+1,iSubStrEnd)
		}
	else {
		// enter the stop date here that will be used if the name is not formatted correctly
		// format for this string is YYYY,MM,DD,HH,MM,SS
		endDateTime = '2015,01,01,0,0,0'
		}
		
	// parse the date
	var params = endDateTime.split(',')
	lyear  = parseInt(params[0])
	lmonth = parseInt(params[1])
	lday   = parseInt(params[2])
	// call the countdown function which will hook itself into a timer and
	//     continue to run every second.
	countdown(lyear,lmonth,lday,params[3],params[4],params[5])	

	//-------------------------------------------------------
	function countdown(yr,m,d,hh,mm,ss){
		var montharray=new Array("Jan","Feb","Mar","Apr","May","Jun","Jul","Aug","Sep","Oct","Nov","Dec")
		hh = ("00"+hh).slice(-2);
		mm = ("00"+mm).slice(-2); //if (mm<10) mm = "0"+(mm+1);
		ss = ("00"+ss).slice(-2); //if (ss<10) ss = "0"+ss;
		theyear=yr; themonth=m; theday=d;
		thehh=parseInt(hh); themm=parseInt(mm); thess=parseInt(ss);
		var today=new Date();
		var todayy=today.getFullYear();
		var todaym=today.getMonth()+1;
		var todayd=today.getDate();
		var todayh=today.getHours();
		var todaymin=today.getMinutes();
		var todaysec=today.getSeconds();
		var todaystring=montharray[todaym]+" "+todayd+", "+todayy+" "+todayh+":"+todaymin+":"+todaysec
		futurestring   =montharray[m-1]   +" "+d     +", "+yr    +" "+hh    +":"+mm      +":"+ss
		var dd    = Date.parse(futurestring)-Date.parse(todaystring);
		var dday  = Math.floor(dd/(60*60*1000*24)*1);
		var dhour = Math.floor((dd%(60*60*1000*24))/(60*60*1000)*1);
		var dmin  = Math.floor(((dd%(60*60*1000*24))%(60*60*1000))/(60*1000)*1);
		var dsec  = Math.floor((((dd%(60*60*1000*24))%(60*60*1000))%(60*1000))/1000*1);
		if(dday<=0&&dhour<=0&&dmin<=0&&dsec<=0){
			// put text in the "countdown" division to show the countdown expired
			document.getElementById("countdown").innerHTML = "<br> Time has run out! <br>";
			return;
			}
		else {
			dhour = ("00"+dhour).slice(-2);
			dmin  = ("00"+dmin).slice(-2);
			dsec  = ("00"+dsec).slice(-2);
			// format the delta time and put in the countdown division to display
			document.getElementById("countdown").innerHTML = 
				"<br> Times out in "+dday+ 
				" days, "+dhour+" hours, "+dmin+" minutes, and "+dsec+
				" seconds  <br>";
			}
		// trigger this routine to run again in 1 second
		setTimeout("countdown(theyear,themonth,theday,thehh,themm,thess)",1000);
		} 

	</script>
	</body>
</html>


TEsting Environment:

  • IE9
  • Win7
This work is licensed under a Creative Commons Attribution By license.

Friday, February 24, 2012

Lesson Learned: Managing Large Numbers of Plots, with an Example in Python

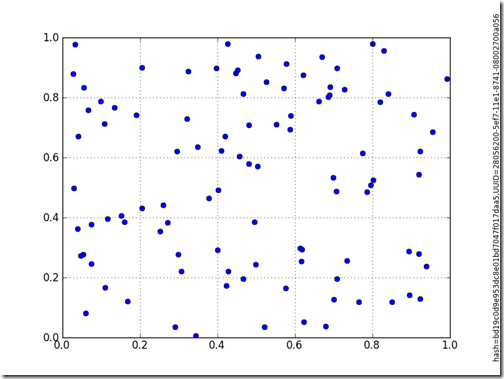
28056200-5ef7-11e1-8741-08002700a056

Problem Statement:

A project generates hundreds, thousands, or more graphs over its life. These graphs are copied and pasted into e-mail, power point slides, etc. The plots become divorced from any of the documents they were originally distributed with. Invariably, at some point in the project, a plot is brought back and the question is what were the assumptions used to generate this graph. With only the graph available, it can be difficult or impossible to answer this question.

To complicate matters, the plots are generated using legacy codes and modifying all of the existing code base is a detailed endeavor.

How can this situation be improved?

Discussion:

There are two problems here. First, a given graph is not traceable to its origin. This can be remedied in one of many ways.  If the source data is well controlled and can be described using a short phase, then adding that phrase somewhere on the chart is helpful. If the source data is constantly changing or requires too much information to describe with a short phrase, then something else is needed. A hash of the input data can help identify and verify the source data set used to generate the graph. A universally unique ID (UUID) can be used to give a graph a unique name. If the source data, assumptions, etc are stored using that same UUID, then when a graph if brought back for review, all of the necessary parts can be found.

The second problem is handling legacy code. There are at least three choices.

  • The first is probably the easiest. A function to add hash and uuid could be created and inserted at the appropriate location in each of the major pieces of plotting code. This is problematic because there are several interfaces and actions in the scripts which could make this work poorly. Also, every plotting routine would need to be modified.
  • A second choice is to wrap the plotting routines into function, then pass this function and its data to a wrapper function which would add a hash and uuid as the last thing done by the plotting routine. If the plotting functions already exist, then this can be done without changing any of the plotting code.   
  • A third choice is to create a decorator which wraps plotting routines, adding the hash and uuid. This has the same issues as using a wrapper call and requires changes to the plotting routines source. However, the changes consist of an import statement and application of the decorator at the correct location.

For this problem, the decorator solution is used. The code that following implements a decorator that creates a hash of the plot data and a UUID which are added to the right side of the plot.  This way, no matter where the plot goes, there is a high likelihood that its pedigree can be preserved.

'''
Script to demonstrate the use of decorators to add a unique identifier to
   a plot. The identifier incudes a hash of input data, to help see if 
   version of a plot really have different data, and a UUID to uniquely 
   identify this plot independent of when or where it was generated.
'''

__author__  = 'Ed Tate'
__email__   = 'edtate<AT>gmail-dot-com'
__website__ = 'exnumerus.blogspot.com'
__license__ = 'Creative Commons Attribute By - http://creativecommons.org/licenses/by/3.0/us/'

from matplotlib.pylab import *
import random
import md5
import uuid

def identifiable_plot(fn):
    def newfun(*args,**kwargs):
        # do before decorated function call
        fn(*args,**kwargs)
        # do after decorated function call
        # create the tag string from a hash of the data and a 
        #    universially unique ID
        x = args[0]
        y = args[1]
        xy = zip(x,y)
        m = md5.new()
        m.update(str(xy))
        this_uuid = str(uuid.uuid1())
        this_tag = 'hash=' + m.hexdigest() + ',' + 'UUID=' + this_uuid
        # write the tag to the figure for future reference
        figtext(1,0.5,this_tag ,rotation='vertical',
                horizontalalignment='right',
                verticalalignment='center',
                size = 'x-small',
                )
        return this_uuid

    return newfun

###############################
    
@identifiable_plot
def my_plot(x,y):
    plot(x,y,'o')
    grid(True)
    
###############################
    
x = [random.random() for i in range(100)]
y = [random.random() for i in range(100)]
    
plot_uuid = my_plot(x,y)
savefig(plot_uuid+'.png')

show()


Test Configuration:
  • win7
  • PythonXY 2.7.2.1

References:
This work is licensed under a Creative Commons Attribution By license.

Using HTML to View Large Sets of Plots - An Example in Python


This example doesn't work because of Blogger limitations. However if you run the example you will be able to select graphs in the generated HTML page.

Problem Statement

You have a program which generates lots of similar plots that end users would like to compare and explore. The end users may not be able to install any code. You can't setup a web server to nagivate the data set. You can not install any new programs on their window's desktop. How to you provide a solution?

Discussion

You can assume that any modern computer at least has a copy of Firefox, Safari, or Explorer. Since there browers support javascript (except in the worst case security settings), you can build a very lightweight data viewer using a few simple methods. The most important design decisions when generating the plots is to name the plots so they are easy to recreate from selections an end user might make.

Example

The following snippet of Python code generates 9 graphs that have random numbers plotted on two axes using different colors and markers. There are three choices of colors and three choices of markers. After generating the plots and saving them, the script creates an HTML file which simplies the navigation of the images. A user can open the HTML page and select the graph by changing the form selections at the top of the page.

There are a couple of key concepts that help make this work:
  • The plot names can be created from selections using javascript. For example, in this example there are three colors and three different markers. All of the plot file names are formed by concatenating the color and marker description to form a plot name.
  • When a user changes their choice of color or marker a javascript function rebuilds the plot file name and causes the browser to reload the image by change the img source.
  • The python script uses templates to set up the bulk of the HTML page, then substitutes in specific options for the user after the plots have been generated. 

import pylab as plt
from random import random
from string import Template

colors  = {'Red_Plot':'r',
           'Blue_Plot':'b',
           'Green_Plot':'g',
           }
markers = {'Circle_Plot':'o',
           'Square_Plot':'s',
           'Diamond_Plot':'d',
           } 

plt.figure()
for c_key in colors.keys():
    for m_key in markers.keys():
        plt.clf()
        plot_name = c_key + ',' + m_key + '.png'
        x = [random() for i in range(0,100)]
        y = [random() for i in range(0,100)]
        color = colors[c_key]
        marker = markers[m_key]
        plt.plot(x,y,color+marker,markersize=15)
        plt.savefig(plot_name)
        
HTML_template = Template('''<head>
   <script language="JavaScript"><!--
      function sel_plot() {
         // only do this if the brower supports images
         if(document.images) {
            // get plot color name
            var e=document.getElementById("color_name");
            var c_name = e.options[e.selectedIndex].text;
            // get plot marker name
            var e=document.getElementById("marker_name");
            var m_name = e.options[e.selectedIndex].text; // create the filename
            // build the filename from these selections
            var plot_filename = c_name + "," + m_name + ".png";
            // cause the correct plot to be loaded
            document["plot"].src = plot_filename;
            }
         }
      // select the plot to display initially after loading document
      window.onload = function() { sel_plot() };
      // silence errors
      window.onerr = null;
   </script>
</head>
<body>
   <center>
      <form name="Plot Select Form" id="plot_select_form">
         <select id="color_name" size="3"
            onchange="sel_plot()">
            $color_options
         </select>
         <select id="marker_name" size="3"
            onchange="sel_plot()">
            $marker_options
         </select>
      </form>
      <img name="plot" src="dummy.png" height="200"
         width="500">
   </center>
</body>
''')
        

# build the option strings
def build_options(opt_dict):
    s = ''
    for i,key in enumerate(opt_dict.keys()):
        if i==1:
            s += '<option selected>'
        else:
            s += '<option>'
        s += key
        s += '</option>\n'
    return s    

color_options = build_options(colors)
marker_options = build_options(markers)

# build the HTML page        
HTML = HTML_template.substitute(color_options=color_options,
                     marker_options=marker_options)
    

# write the HTML page
f = open('example.html','wb')
f.write(HTML)
f.close()

Test Configuration

  • PythonXY 2.7.2.1
  • IE 9


This work is licensed under a Creative Commons Attribution By license.